BYU Student Author: @Erick_Sizilio
Reviewers: @Nate, @Parker_Sherwood
Estimated Time to Solve: 20 Minutes
We provide the solution to this challenge using:
- Tableau
Need a program? Click here.
Overview
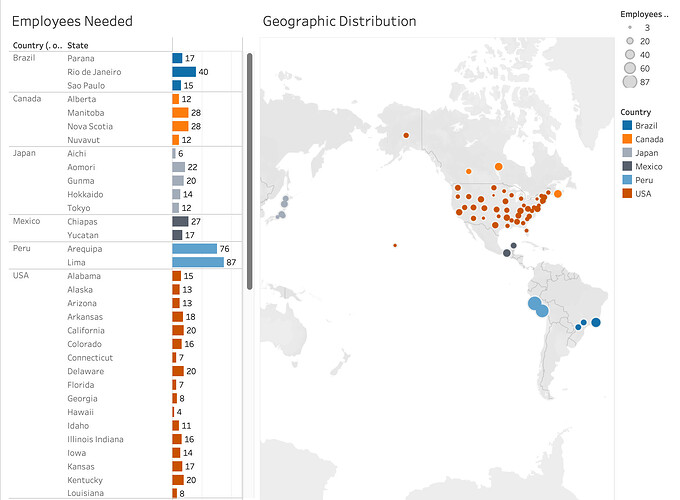
You are a new hire at a tax accounting firm that is expanding rapidly. The company has been successful because it hires the exact number of employees needed for each year. Your boss asked you to create a simple dashboard in Tableau that shows how many employees will be needed by country/state. Your boss provided two tables: 1) Number of tax returns to be completed by country and by state, and 2) Number of tax returns each employee within a country can complete. (This differs from country to country because of the level of training, tax code complexity, and technology available to them)
Instructions
- Download the data
- Load it into Tableau
- Join the two tables
- Create two separate sheets as follows: 1) Show how many employees will be needed by country/state on a table, and 2) the total number of employees needed by country/state on a map!
- Combine these sheets into a dashboard
Data Files
Suggestions and Hints
When calculating the number of employees needed, ensure that you round up any numbers. A fraction of a person can’t do any work ![]() . You can round up by using the ceiling function)
. You can round up by using the ceiling function)
Solution
Challenge16_Solution.twbx
Solution Video: Challenge 16|TABLEAU – Tax Prep Startup


