BYU Student Author: @Alex_Garrett
Reviewers: @IWillyerd, @TylerBooth, @Brett_Lowe
Estimated Time to Solve: 30 Minutes
We provide the solution to this challenge using:
Need a program? Click here.
Overview
You recently started your summer internship at Wheelz Distribution Company, a toy car distributor located in Los Angeles, California. In your interview, you mentioned that you have some experience with Tableau, and your boss said that she would love to have a dashboard that “brings to life” the data that they have from the previous year, 2020. Your boss will present these visualizations at the mid-year meeting, so it’s important that your work is descriptive and easy to understand.
Instructions
Your boss gave you access to the company’s sales spreadsheet for the past 30 months from which you will build your visualizations. She has also given you some requirements about what visualizations you should create. Here’s what you wrote down from your meeting with her:
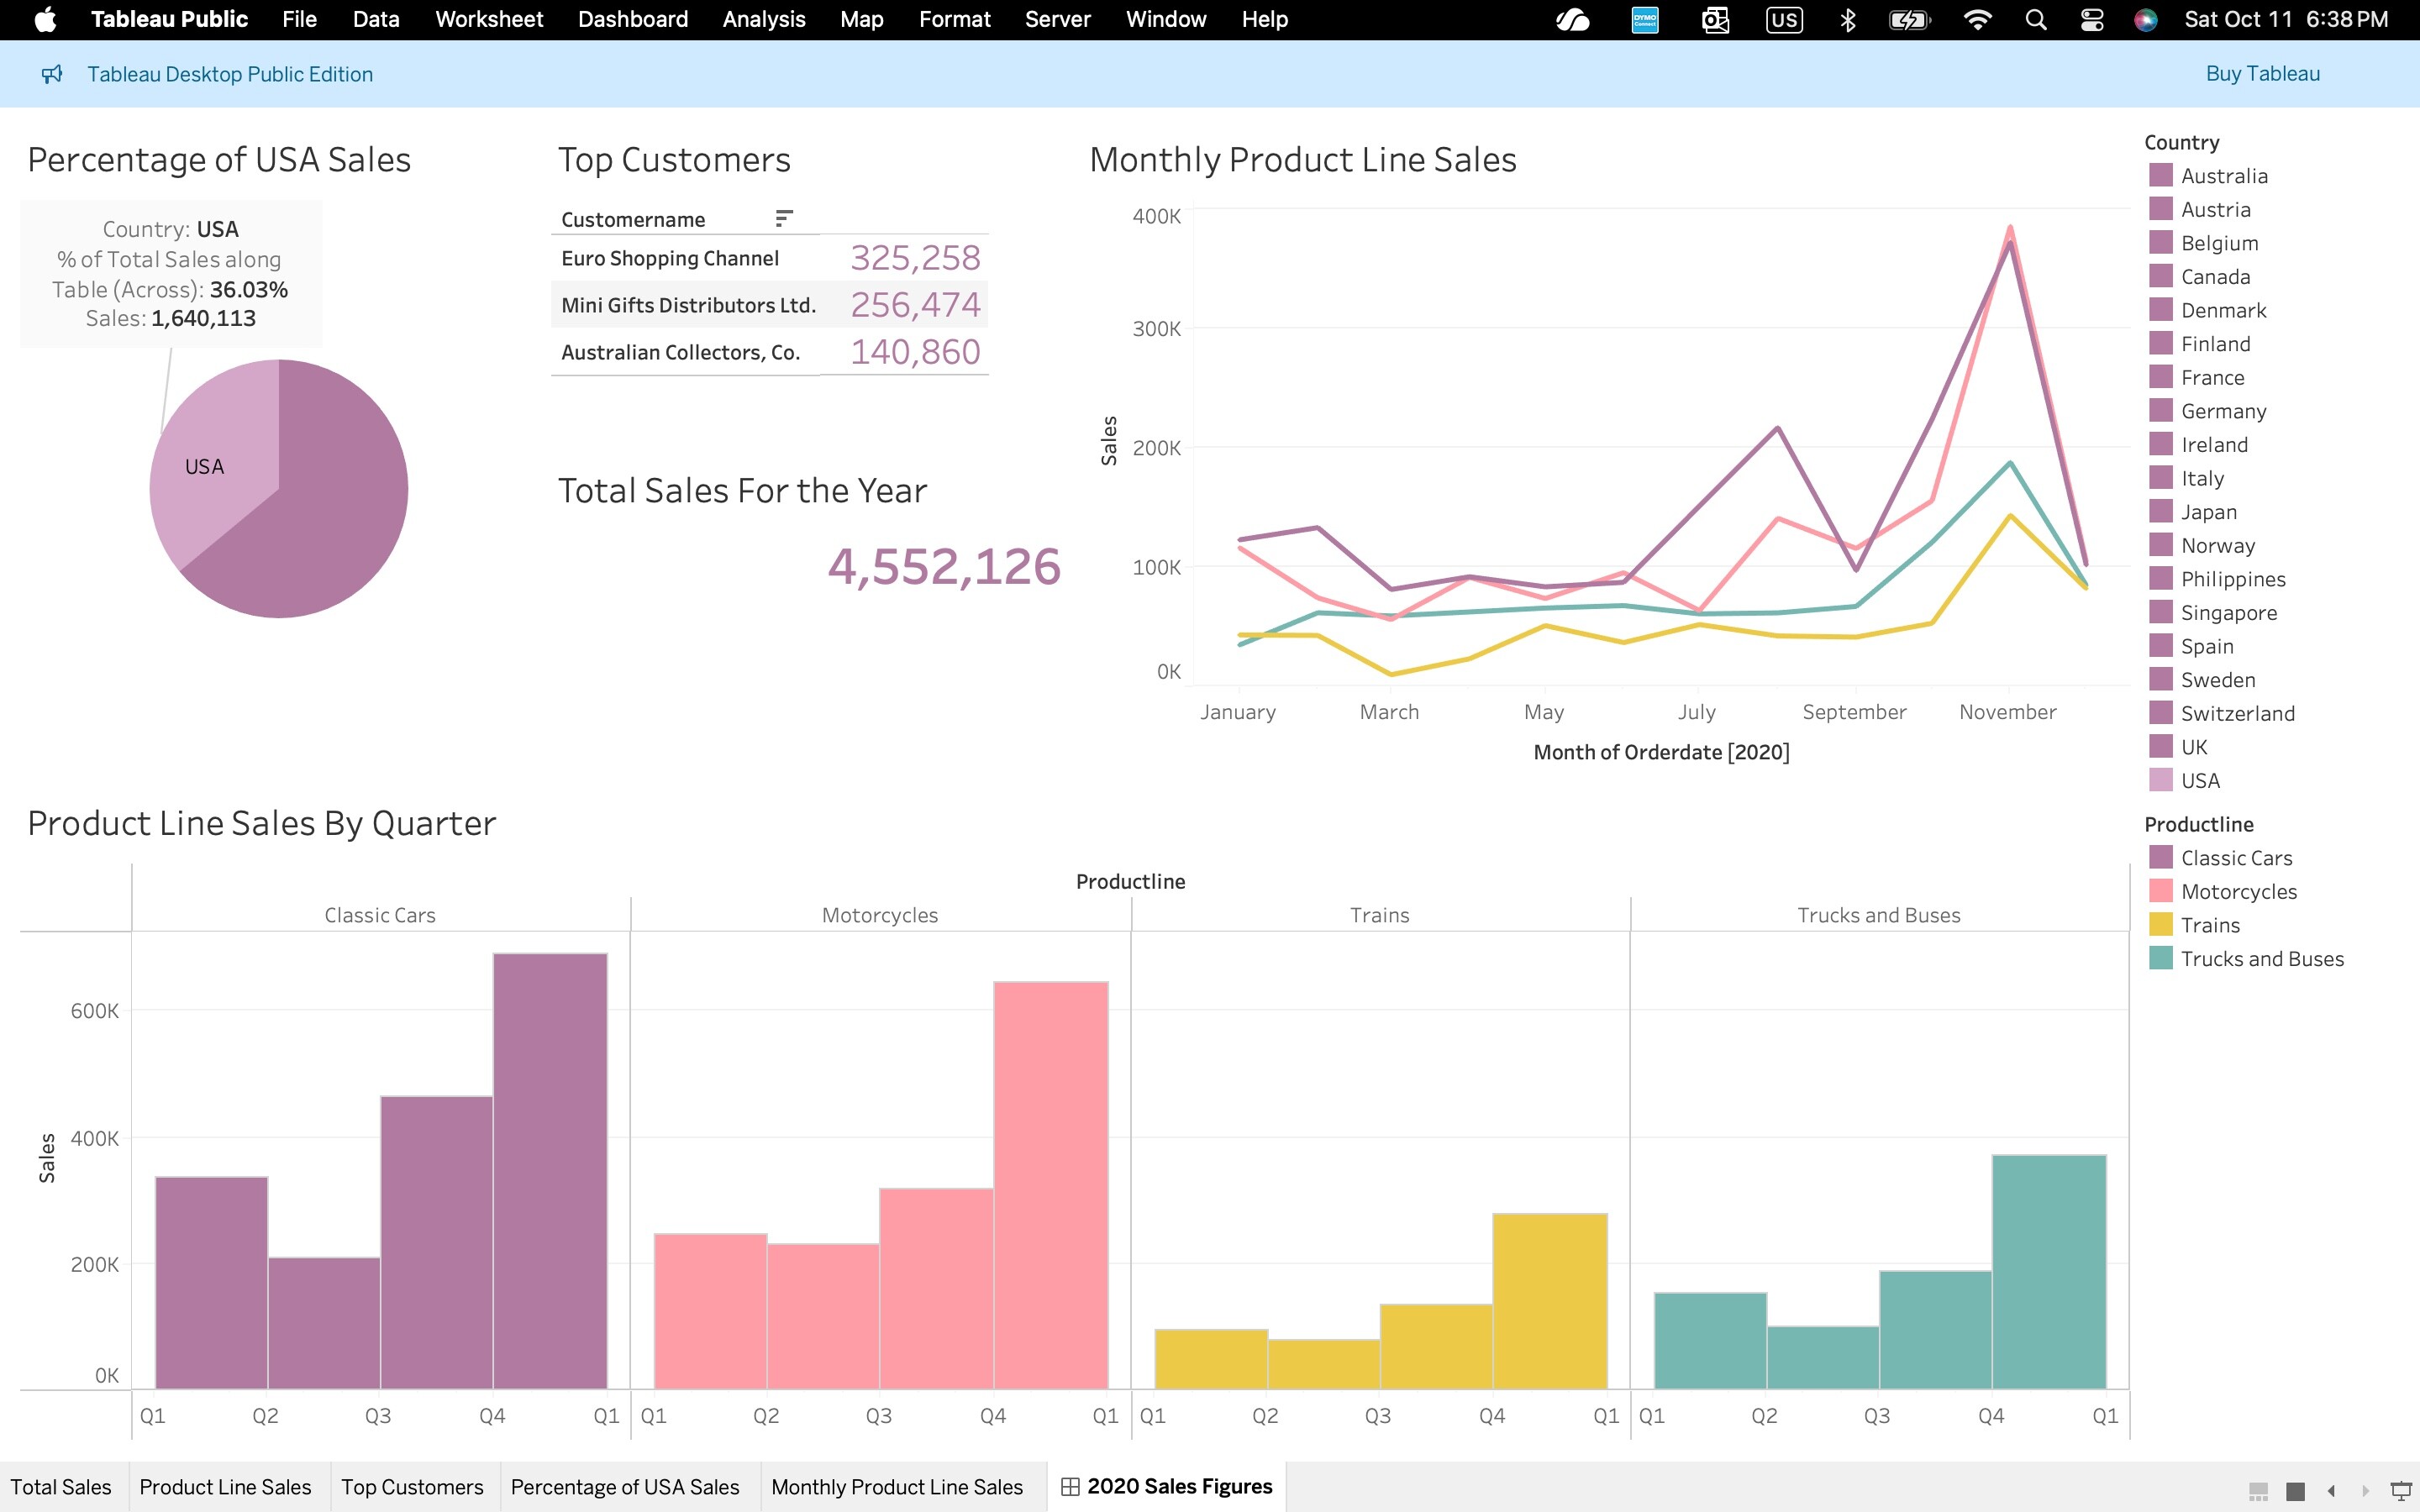
- Include a title and a description of what the dashboard represents.
- Display total sales for the year using a text table.
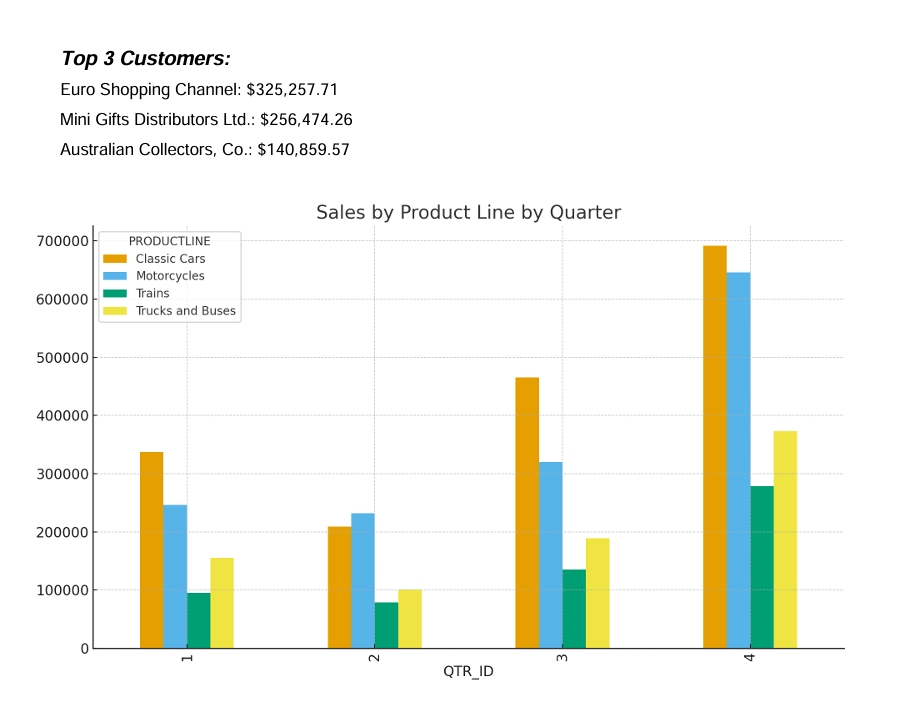
- Compare sales across product lines by quarter using a side-by-side bar chart.
- Display the top 3 customers and their total sales using a text table.
- Show the proportion of sales made in the US versus outside the US using a pie chart.
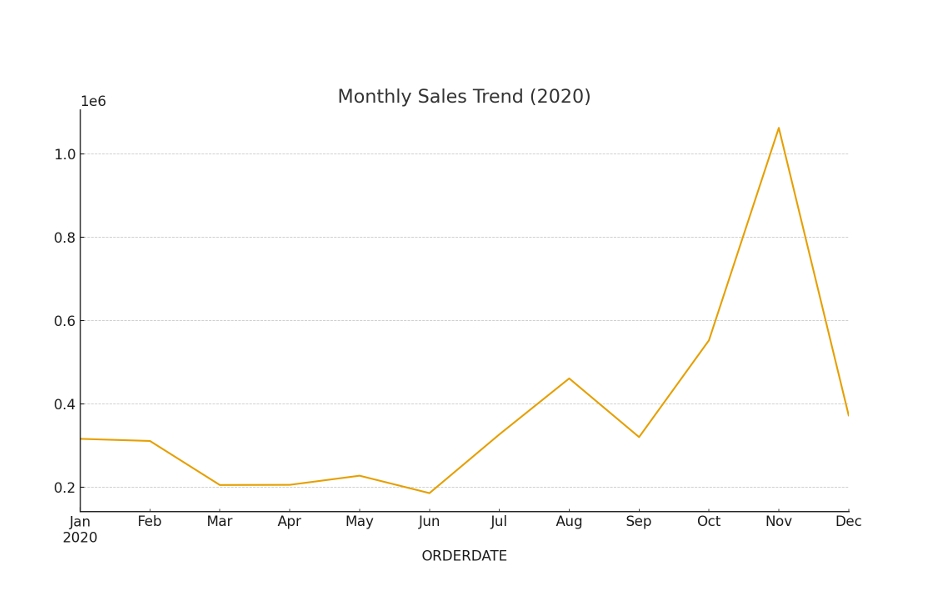
- Include 1 other visualization that you think would be helpful for shareholders to see.
Remember these helpful tips when creating your dashboard:
- Your boss will be presenting this data to shareholders for the 2020 financials. In other words, leave out all other years of data.
- Orders with a status of “cancelled” or “on hold” do not represent actual revenue so make sure to filter these rows out.
Your boss didn’t give you a detailed list of steps to follow, rather she gave you room to be creative, as long as it looks professional. Get creative! Your dashboard may not look the same as the solution provided, but we’ve provided a few check figures below to make sure you’re on the right track (i.e., dollar amount for 2020 revenue, top 3 customers, etc.)
Data Files
Check Figures
Check Figures
- Total 2020 Sales Revenue: $4.55M
- Top 3 Customers: Euro Shopping Channel; Mini Gifts Distributors Ltd.; Australian Collectors, Co.
- 2020 USA Sales: $1.64M (36.03%)
Solution