BYU Student Author: @Hyrum
Reviewers: @TylerBooth, @Erick_Sizilio, @klayton
Estimated Time to Solve: 25 Minutes
We provide the solution to this challenge using:
- Tableau
Need a program? Click here.
Overview
You’re about to be the investing MVP of your crew! You’ve decided to assist some of your friends in launching their own investment company. As the designated accountant, you’ve received a wealth of financial data on the companies that your crew’s got their eye on. They’ve asked you to condense the data into easily digestible nuggets and present it to the group next week.
You’ve already worked your magic and compiled the data into a stunning Excel sheet, but you know that non-accountant types prefer pictures and graphs. That’s when you had a lightbulb moment: why not use Tableau to create some fun and funky charts for your buds? With your new visual aids, your friends will be able to absorb your research like it’s a piece of cake!
Instructions
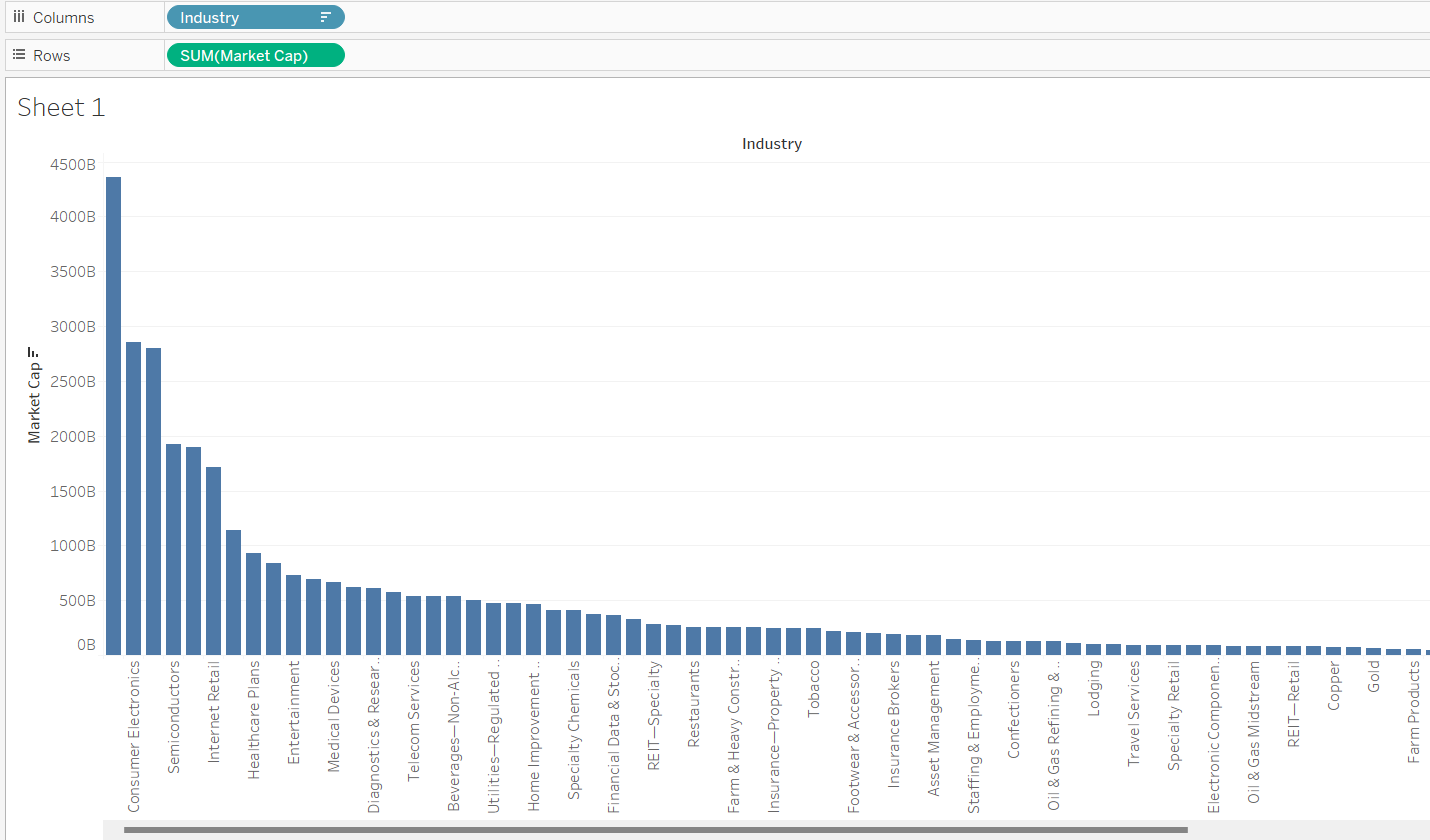
- To get started, make a bar chart of the industries as the x axis, and the market cap as the y axis. Which industry has the highest market cap?
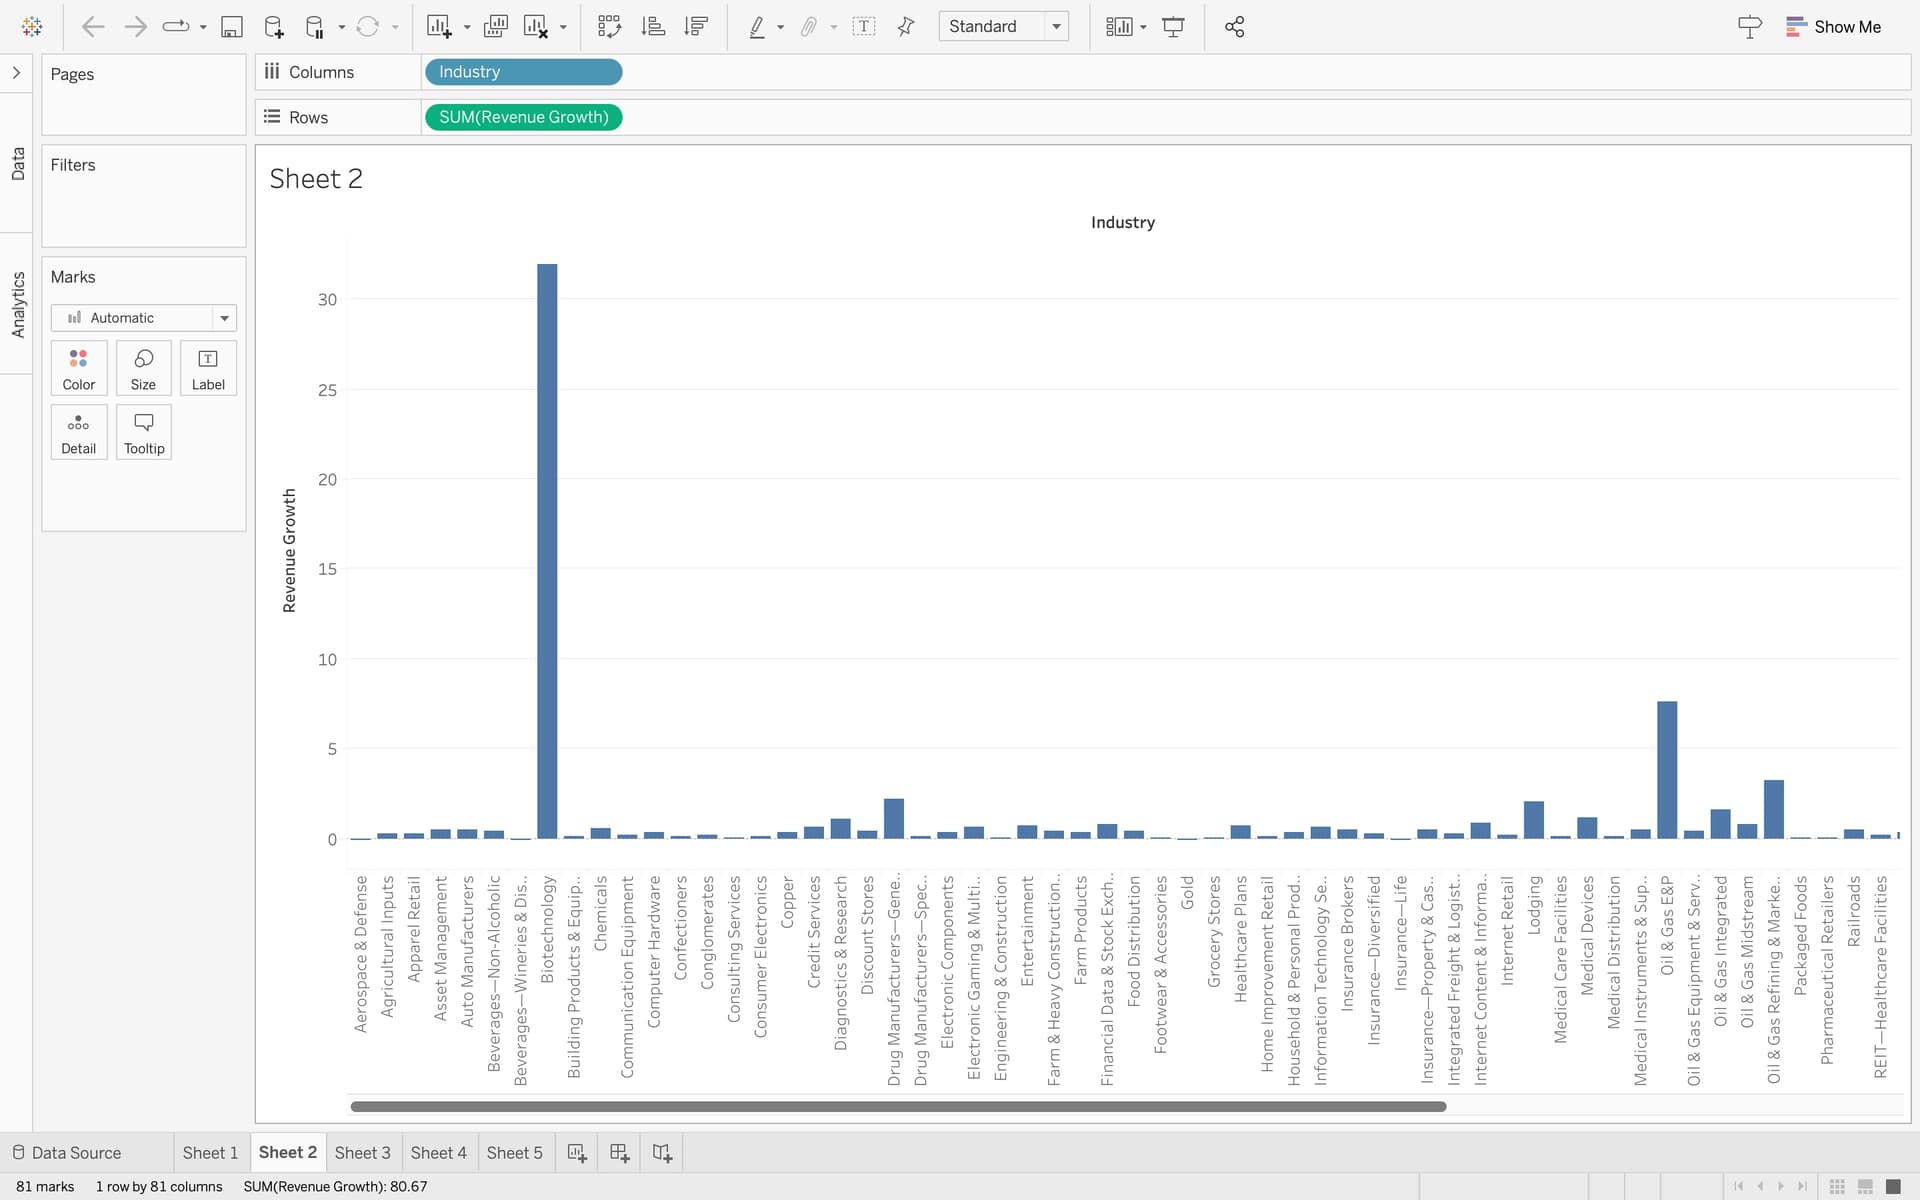
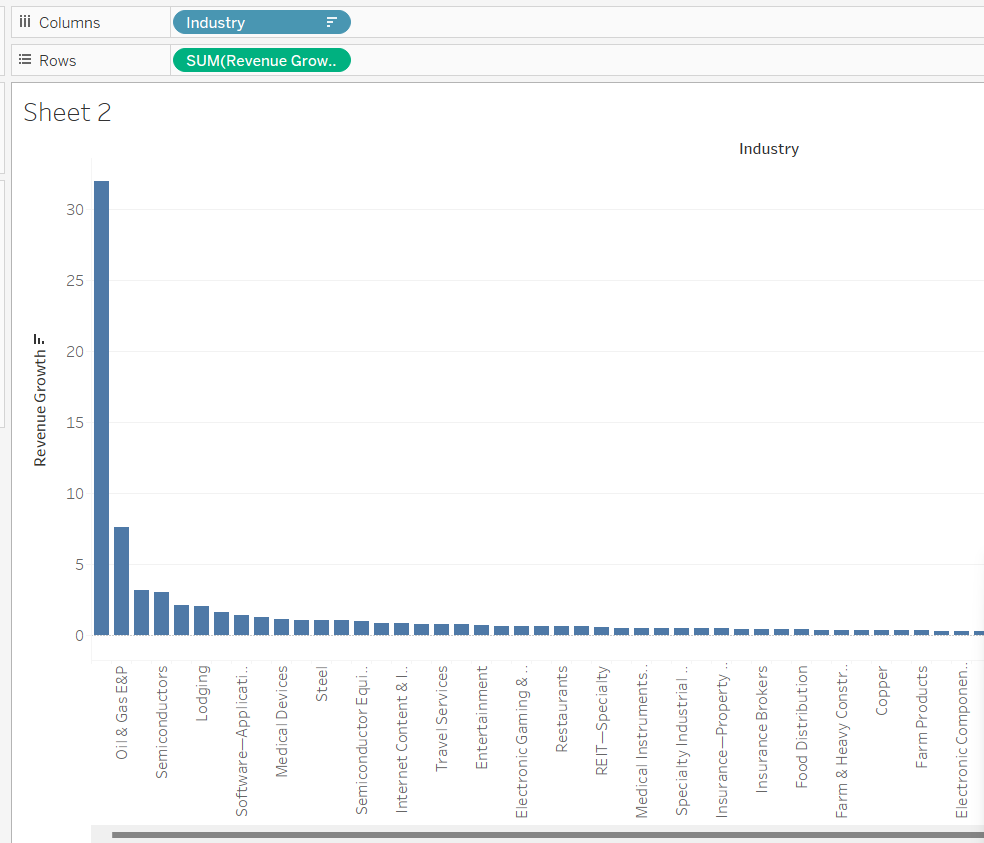
- Now make a visualization that clearly shows which industry has the highest Revenue growth. Which industry has the highest? Which industry has the lowest? What industry would you suggest your friends put their money into?
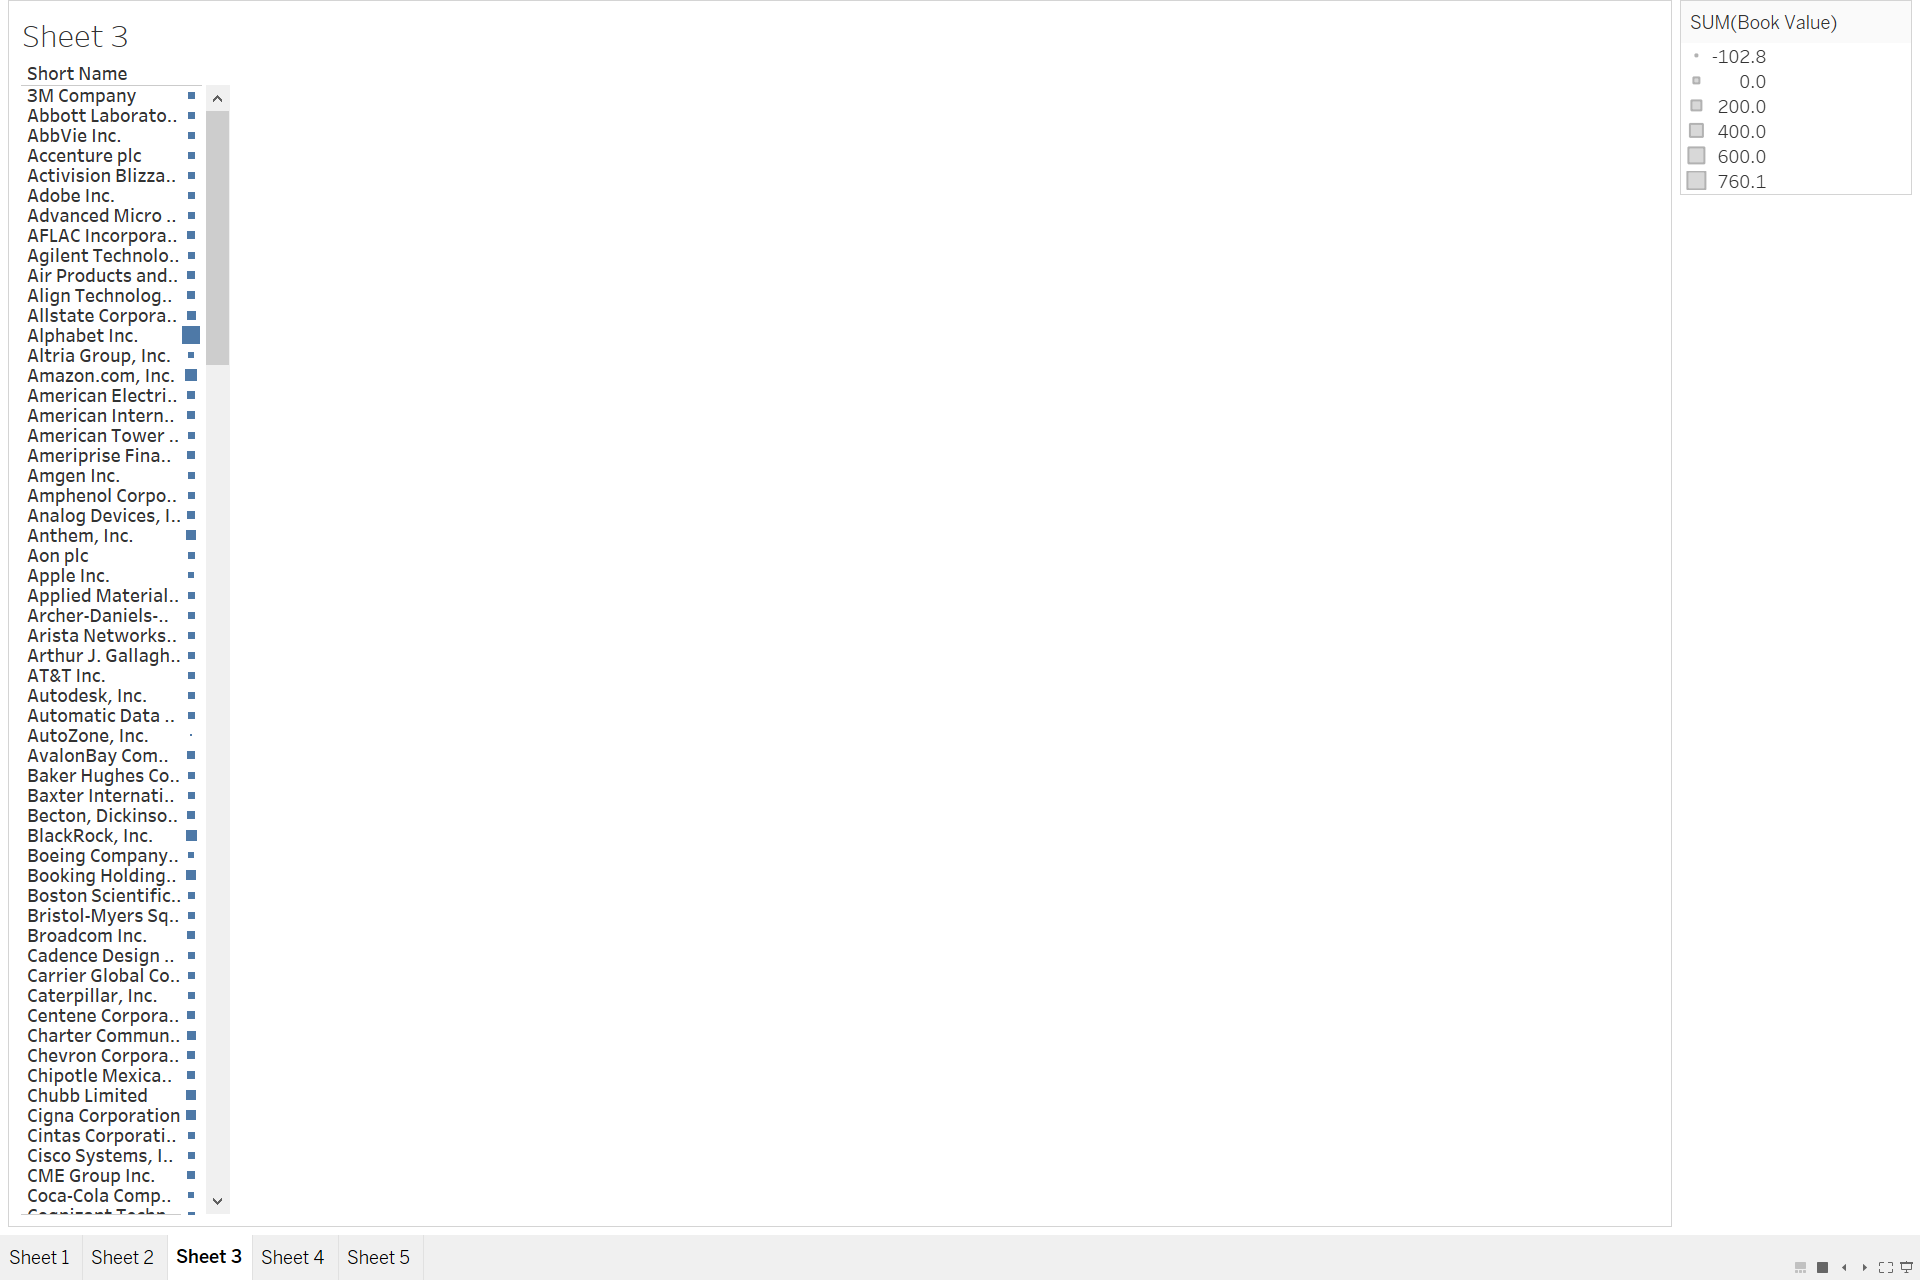
- Make a heat map that shows the book value of individual companies. Which company has the highest book value?
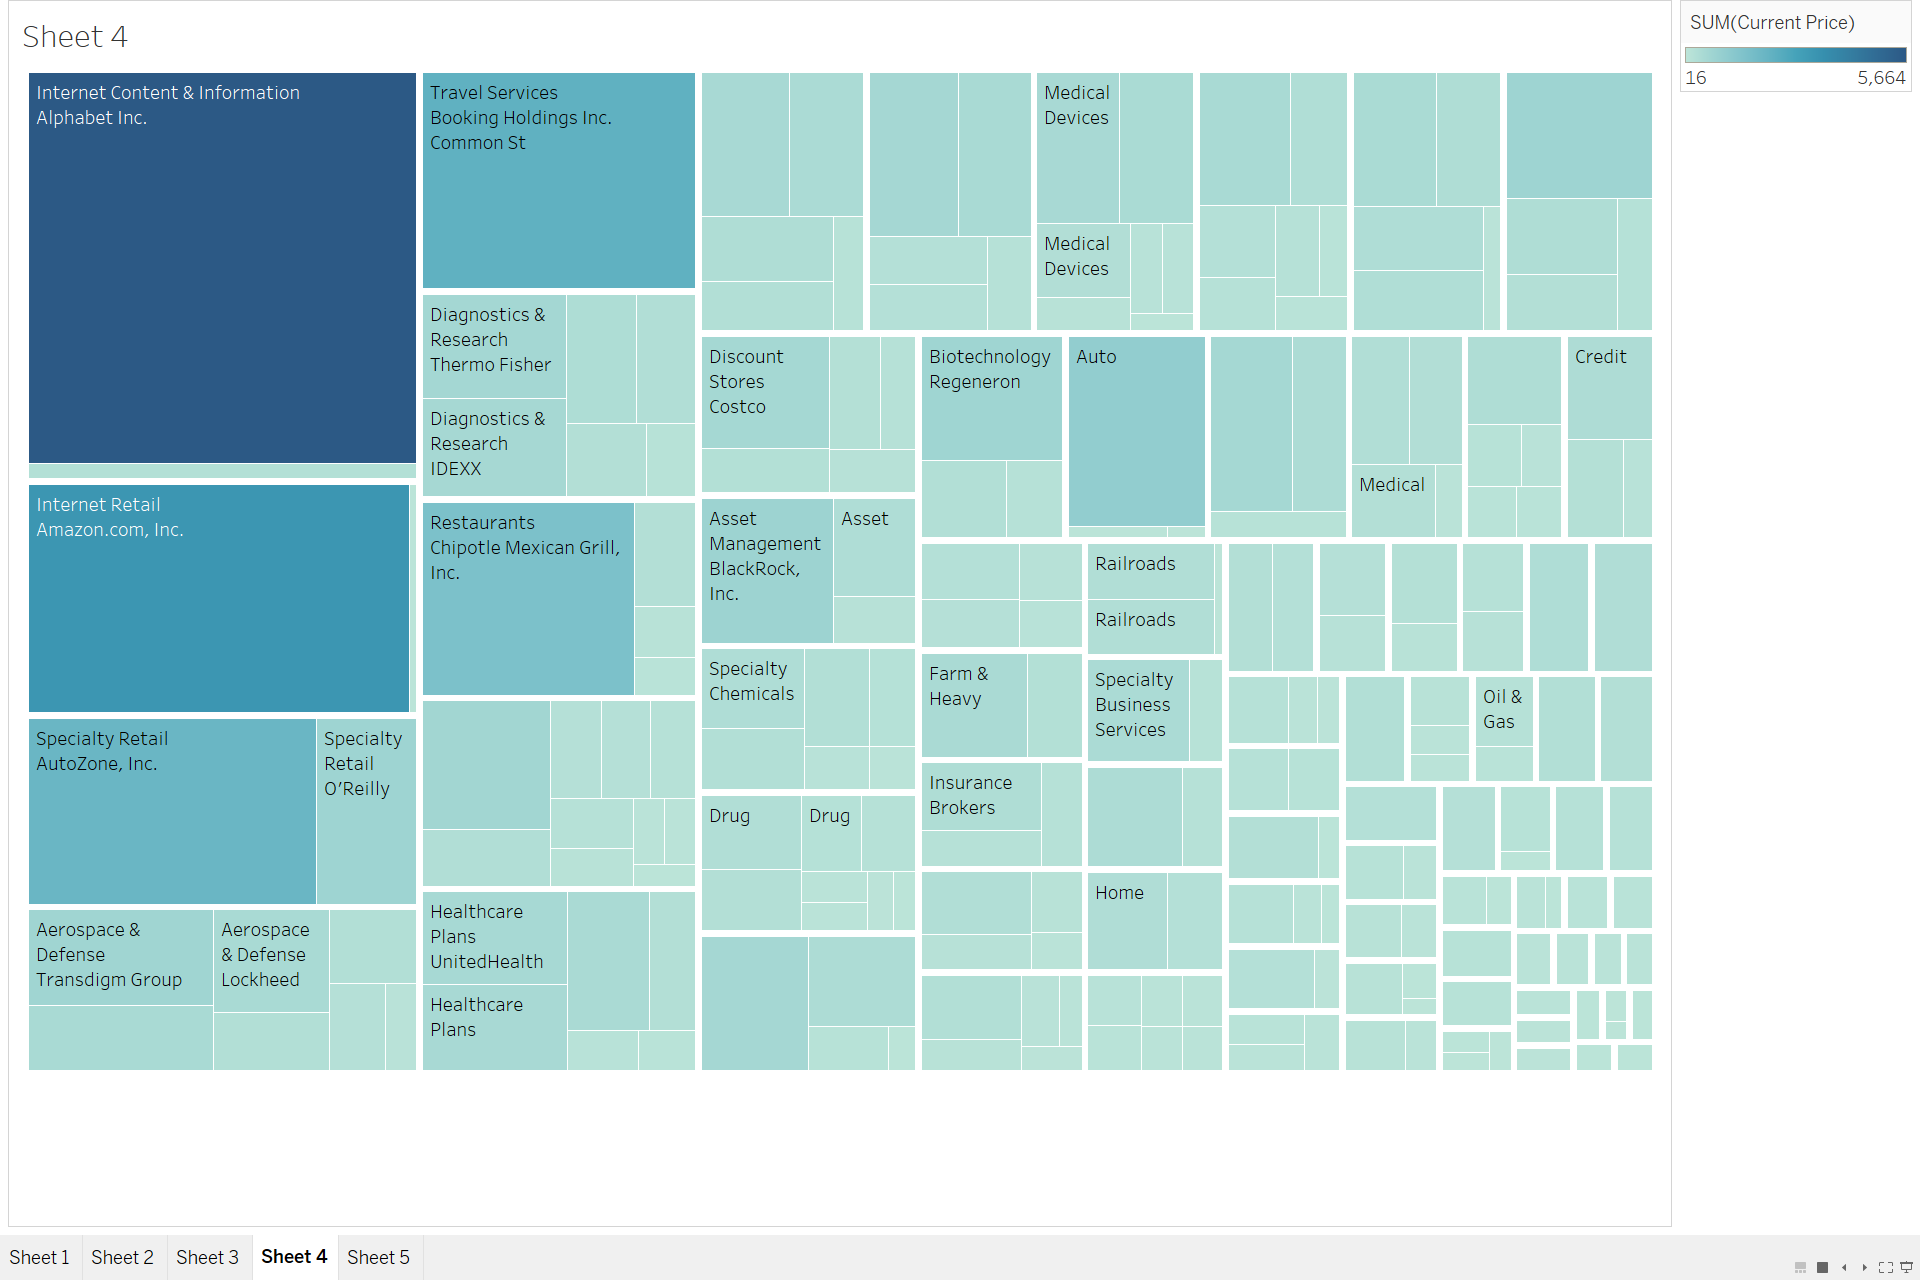
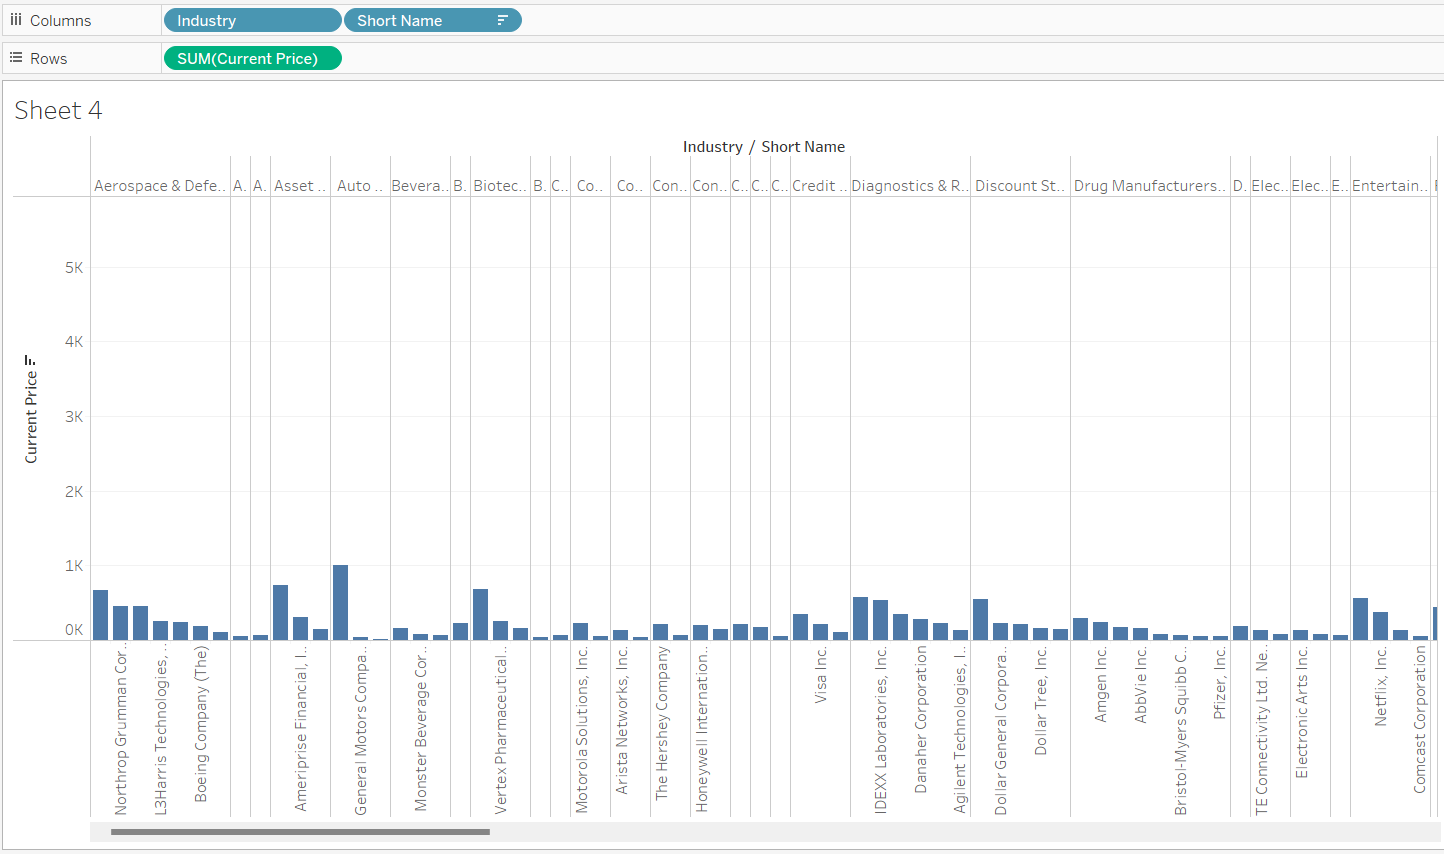
- Segment the industries by their individual companies and use the current price as an estimation of how the market views the value of these companies. Which company is the most valuable? Which industry has the most valuable companies? Are there any industries that have a lot of disparity?
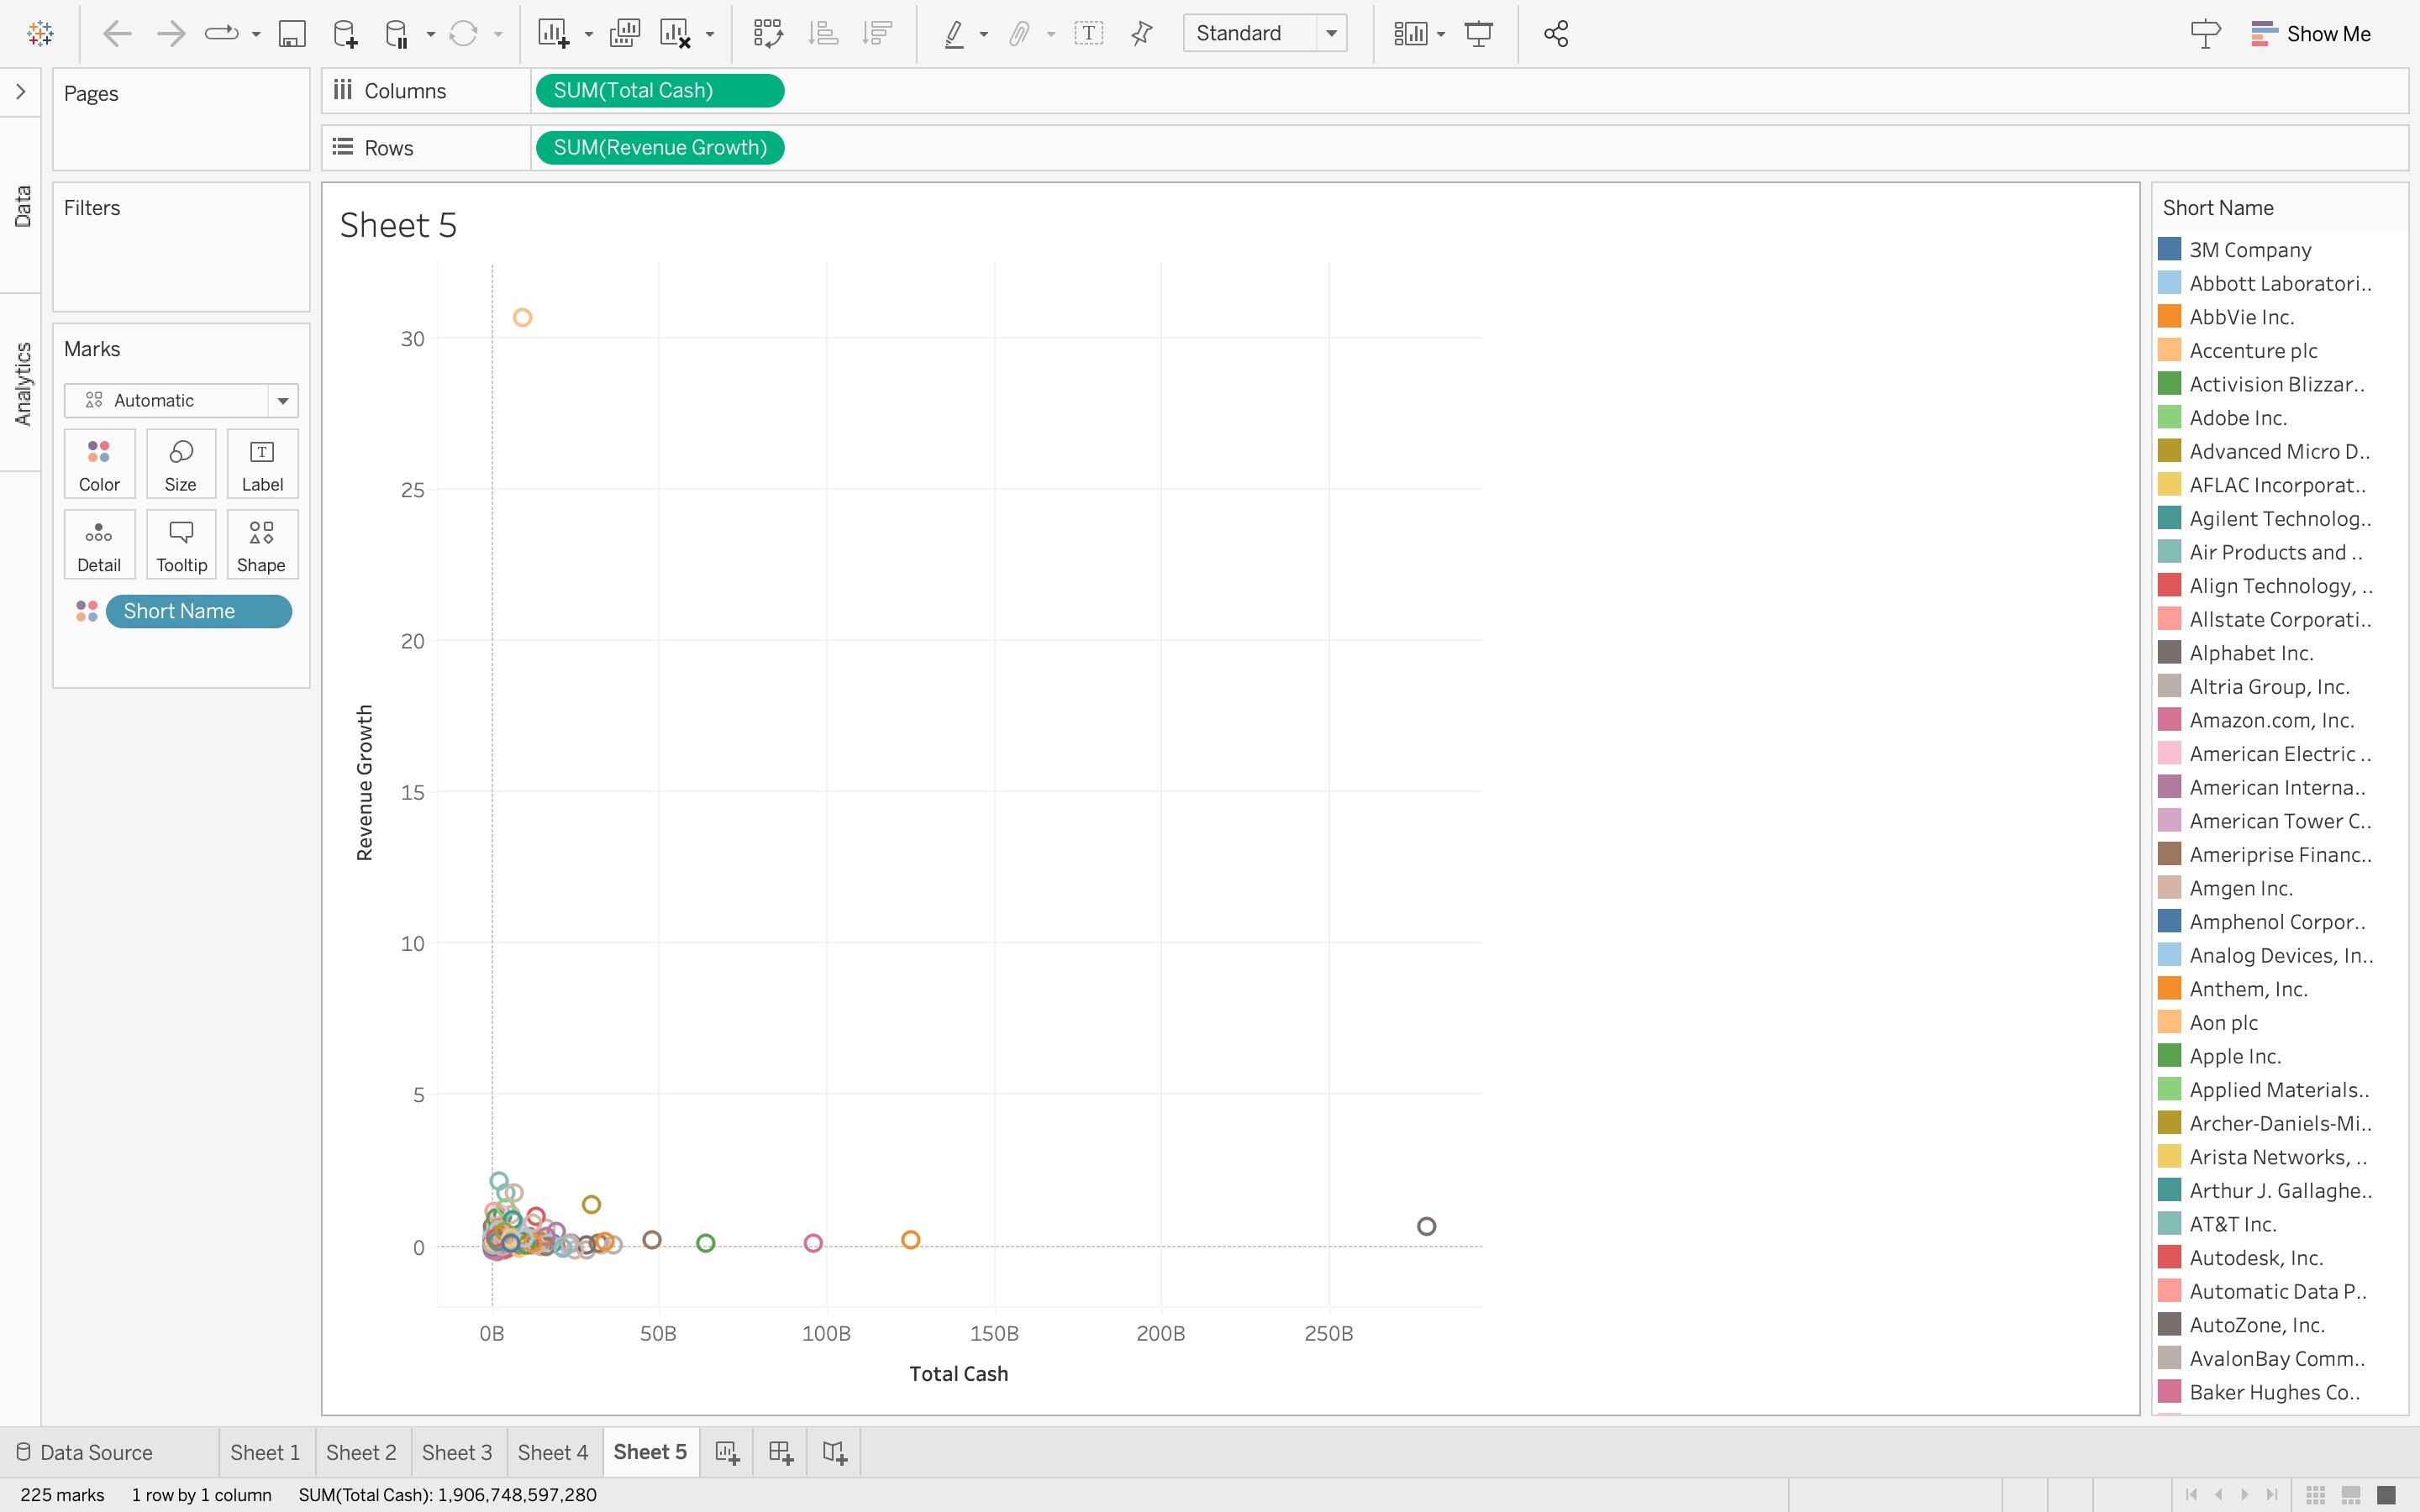
- In accounting, having a lot of loose cash on hand is typically a bad idea since that cash could be used for developing the company or researching improvement. Make a scatterplot that shows total cash against revenue growth of the company. Is there anything concerning about some popular companies you would like to discuss with your friends? Why might these companies be holding so much cash?
- Make your own visualization from the dataset that you find interesting! Share it in a picture in our website for others to see and learn from!
Data Files
Suggestions and Hints
To segment data, you will need two discrete datasets (the blue data) in the columns window.
Solution