BYU Student Author: @James_Behling
Reviewers: @Abraham_Reyes_Leon, @Jason_Nguyen
Estimated Time to Solve: 30 Minutes
We provide the solution to this challenge using:
- Excel
- Tableau
Need a program? Click here.
Overview
As an investor in the stock market, it is essential to analyze the historical performance of different companies to make informed investment decisions. In this challenge, you will conduct a “what-if” analysis to compare potential returns from investing in different S&P 500 companies. Using Tableau, you will create a visualization that allows users to select a start date and see how a chosen stock’s price movement compares to another stock over a specified period. The dataset includes open, close, volume, high, and low prices for S&P 500 companies from 2013 to 2018.
Your goal is to create a Tableau visualization that normalizes stock prices to 0% at the selected start date, allowing you to track their growth or decline over time. This approach enables an easy and direct comparison between different stock.
Instructions
Note that this challenge is designed to encourage users to explore Tableau and discover how to complete each step through experimentation. If you need help with specific steps, feel free to watch our step-by-step solution video or leverage GenAI!
-
Load the dataset into Tableau.
-
Create a calculated field to index each stock’s closing price movement from 0% at the selected start date (View the suggestions and hints section to see our formula).
-
Ensure that the data is aggregated on a monthly basis.
-
Build a visualization that allows users to:
a. Filter to a specific date range.
b. Select and compare different companies.
c. Observe how stock values for each company change over time relative to their starting value. -
Format the visualization to enhance clarity and readability.
Data Files
Suggestions and Hints
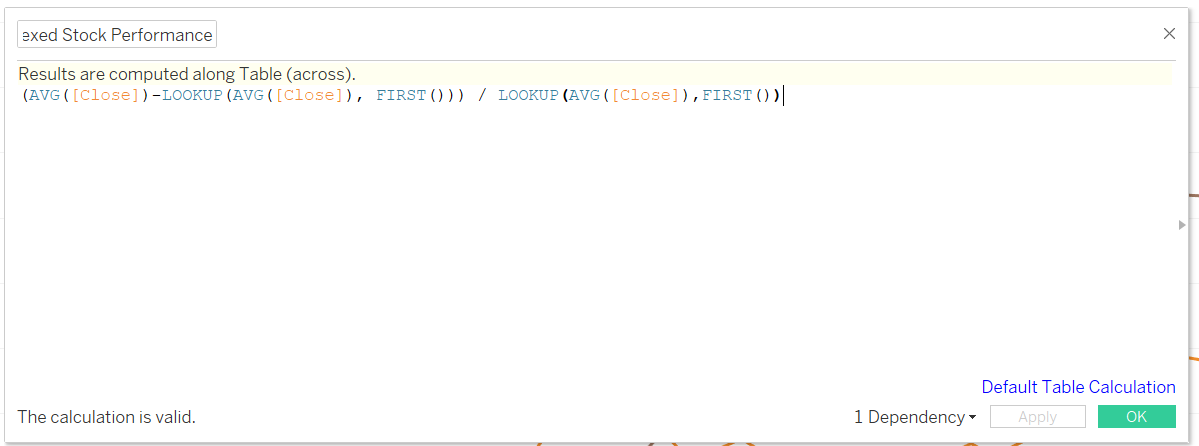
The formula to use for indexing stock growth is:
(AVG([Close]) - LOOKUP(AVG([Close]), FIRST())) / LOOKUP(AVG([Close]), FIRST())
Watch the solution video to see how we built this tableau visualization step-by-step!
Solution