BYU Student Author: @Marta_Ellsworth
Reviewers: @Sterling_Lane, @Millie_K_B
Estimated Time to Solve: 15 Minutes
We provide the solution to this challenge using:
- Alteryx
- Tableau
- Go here to perform this challenge in Python
Need a program? Click here.
Overview
You have a friend, Alice, who is a rising TikTok influencer. She has been active on TikTok for a while and is curious about the trends in earnings and views from the videos she’s posted. Alice knows you have previously analyzed influencer data and wants to draw on your expertise. Your task is to help Alice analyze her TikTok earnings and video views and you decide to utilize Alteryx and Tableau to present your findings.
Instructions
- Load Alice’s TikTok data into Alteryx.
- Alice exported the data every few months, so she is worried there may be some duplicates.
- Alice would also like a new column that categorizes videos based on views.
a. Low Views: Less than 10,000 views
b. Medium Views: 10,000 to 30,000 views.
c. High Views: More than 30,000 views. - Export the cleaned and categorized data from Alteryx as an Excel file and import it into Tableau.
- In Tableau, create a line graph showing earnings overtime by quarter.
- Create a bar chart in Tableau that displays the total number of views for each category (Low, Medium, High) in the newly created views category.
- Assemble both graphs into a dashboard for Alice to review. What quarter of the year does Alice struggle in?
Data Files
Suggestions and Hints
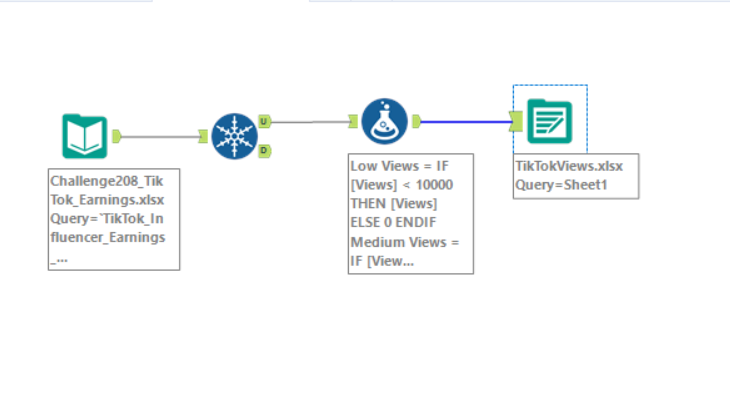
- Utilize the Unique tool in Alteryx to remove duplicates.
- Use the Formula tool in Alteryx to create the views categories with an IF statement.
- When working in Tableau, ensure you sum the views for accurate representation of the views per category.
-Start by creating the individual graphs in Tableau and then combine them into a dashboard.
Solution