BYU Student Author: @Hyrum
Reviewers: @Nate, @Mike_Paulsin, @Parker_Sherwood
Estimated Time to Solve: 20 - 30 Minutes
We provide the solution to this challenge using:
- Python
Need a program? Click here.
Overview
As a problem solver for a growing accounting firm, your boss has presented you with an exciting opportunity: to create a Python program that will revolutionize their financial management. Your task is to build a program that can calculate the total revenue and expenses for a small business in its first quarter, providing insights into the company’s performance.
In this challenge, you will put your coding skills to the test by utilizing a simulated small business dataset that mirrors real-life financial data. By completing this challenge, you will not only improve your coding proficiency, but also help your accounting firm achieve new levels of financial success through accurate and efficient data analysis.
Instructions
Your program should do the following:
- Calculate the total revenue and expenses for each category (The other information is not relevant)
- Combine each month into one quarter
- Print the total revenue, total expenses, and whether the business is making a profit or a loss for the quarter
- Allow the user to export the results to an Excel file containing the combined data
Data Files
Suggestions and Hints
Use Pandas for uploading and downloading into python as a dataframe
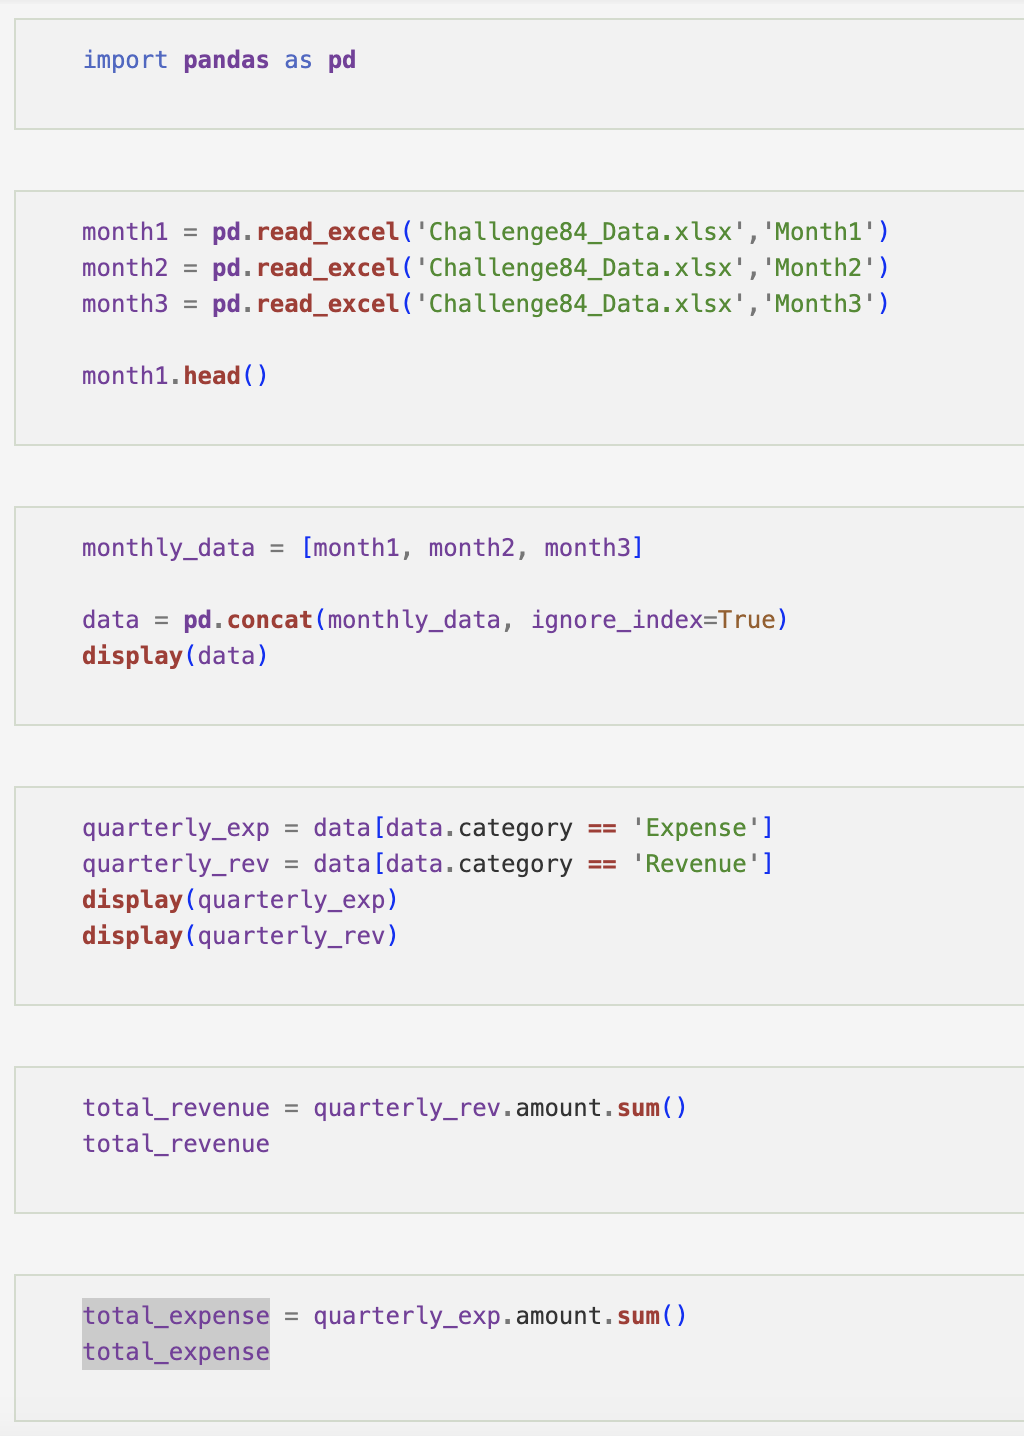
Solution
Solution Code
import pandas as pd

# Read transactions from Sheet1, Sheet2, and Sheet3
df1 = pd.read_excel('ChallengeX_First_Quarter_Crisis.xlsx', sheet_name='Month1')
df2 = pd.read_excel('ChallengeX_First_Quarter_Crisis.xlsx', sheet_name='Month2')
df3 = pd.read_excel('ChallengeX_First_Quarter_Crisis.xlsx', sheet_name='Month3')

# Concatenate the four DataFrames vertically
df = pd.concat([df1, df2, df3], ignore_index=True)

# Calculate total revenue and expenses
revenue = df[df['amount'] > 0]['amount'].sum()
expenses = df[df['amount'] < 0]['amount'].sum()
profit_loss = revenue + expenses

# Print results
print(f"Total Revenue: {revenue}")
print(f"Total Expenses: {expenses}")
if profit_loss >= 0:
    print(f"Profit: {profit_loss}")
else:
    print(f"Loss: {profit_loss}")

# Export to Excel file
writer = pd.ExcelWriter('combined_transactions.xlsx')
df.to_excel(writer, index=False, sheet_name='Combined Transactions')
writer.save()
This code reads data from four sheets named " Month 1", " Month 2", and “Month3” in an Excel file named “ChallengeX_Dataset.xlsx”. It then concatenates the four data frames vertically to create a single DataFrame named “df”.
The code then calculates the total revenue and expenses by filtering the “amount” column of the DataFrame for positive and negative values, respectively, and computing the sums. It also calculates the profit or loss by adding the revenue and expenses together.
Finally, the code exports the combined transactions DataFrame to an Excel file named “combined_transactions.xlsx” and saves it on the disk.
Solution Video: Challenge 84|PYTHON – First Quarter Crisis